Numbers drive humans – whether it’s a hike in salary or a dip in school grades. The same goes for every podcast creator. The numbers in your data analytics tell you how your podcast has done so far and how you can improve your content and audience engagement.
Hubhopper provides creators with a robust data analytics dashboard that provides cumulative data on their podcast’s performance, regardless of where it is distributed. The dashboard also includes Spotify analytics separately.
Recently, this dashboard has become more insightful. You can now check top locations, compare episode listens, see top hours along with top episodes all in your Hubhopper data analytics dashboard.
This article will tell you how to decode your data analytics to understand it better and use that data to grow your audience.
Hubhopper data analytics dashboard overview
You can access a lot of insightful statistics inside your Hubhopper data analytics dashboard.
From the top, you can see your all time listens i.e., total listens of your podcast from all episodes combined.
Note: These all times listens don’t include your Spotify listens. You get separate Spotify analytics at the end of the dashboard.
You have the option to select a time range to display analytics. You can see analytics from as recent as the last 7 days to as far back as 90 days.
Next, you get a brief analytics overview followed by detailed analytics of your podcast. Your detailed analytics includes:
- Daily listens
- Top hourss
- Episode listens
- Your top episode
- Top locations
- Your Spotify analytics.
Here’s a breakdown of these data statistics, what they mean and how you can use them to your advantage.
Analytics Overview
The Analytics Overview is a summary of your podcast analytics during the chosen period.
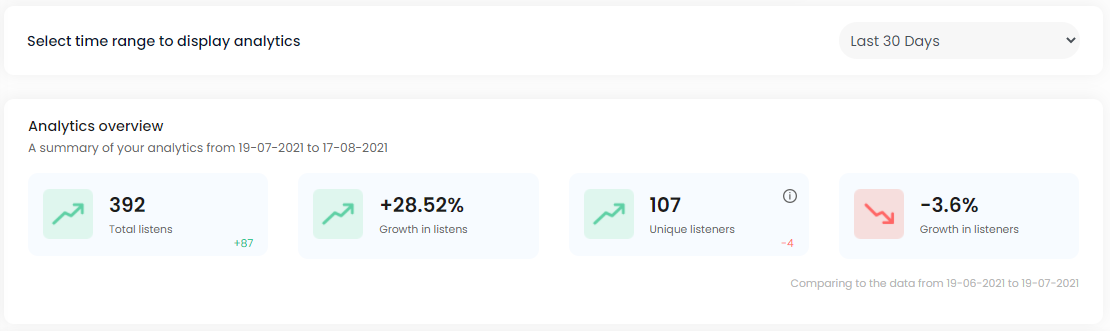
It gives you a glimpse of the total listens and the number of unique listeners you acquired during this period.
Unique listeners are those who have listened to your podcast at least once during the given period.
It also shows whether you saw any growth in listens and listeners. This data is drawn from the comparison between the latest analytics to the previous analytics. So, if you choose analytics for the past 30 days, the data will be drawn by comparing analytics of the last 30 days and analytics of 30 days before that.
Daily Listens
Daily listens show the number of listens you got daily in the chosen period.
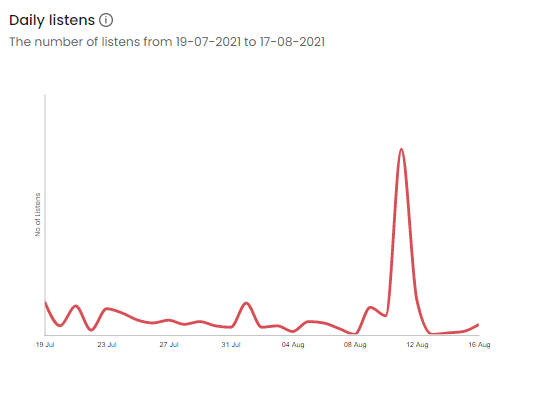
In this graph, the podcast had the most listens on 11th August. Before that, there’s been a rise and fall in the listens.
You can use this information to figure out your listeners’ preferences. Did it get more listens on the day you published the episode? Does your podcast get more listens on weekdays? Has the number of listens declined because of a change in your podcast format?
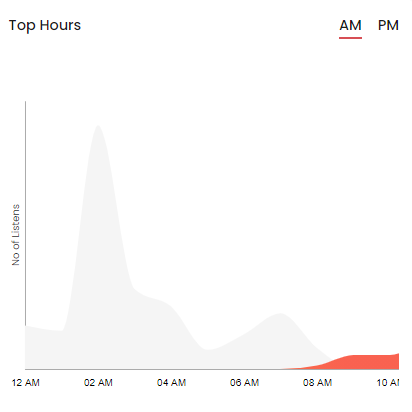
Top Hours
Like it says, this data shows the top hours when your podcast is being streamed the most by listeners. You can compare the listening hours of the mornings and evenings as the data for both is provided separately under AM and PM options.
The graph below shows podcast listens in the early morning hours.
The graph below shows podcast listens during the evening hours.
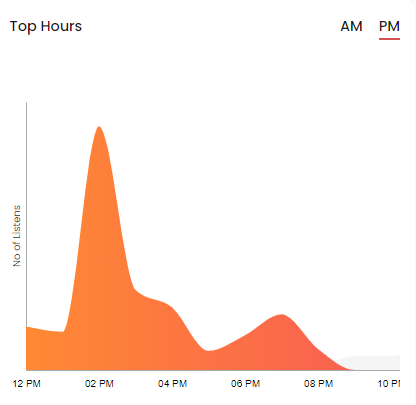
When you see the two graphs, you notice how the podcast started streaming around 8 in the morning. These are the hours when people are usually commuting to work.
The podcast was streamed the most around 2 PM and continued streaming until 8 PM. The evening hours are mostly for leisure listening.
This kind of analytics lets you know the hours when your audience likes to listen to your podcast and hints to a listening pattern that you can use in your content.
You can use this information to decide when to upload the next episode. It will also help you to communicate with your current and potential listeners when they are most active.
Episode Listens
You can view listens of all your episodes under Episode Listens. This helps you in comparing the episodes and understanding why some did better and others did not.
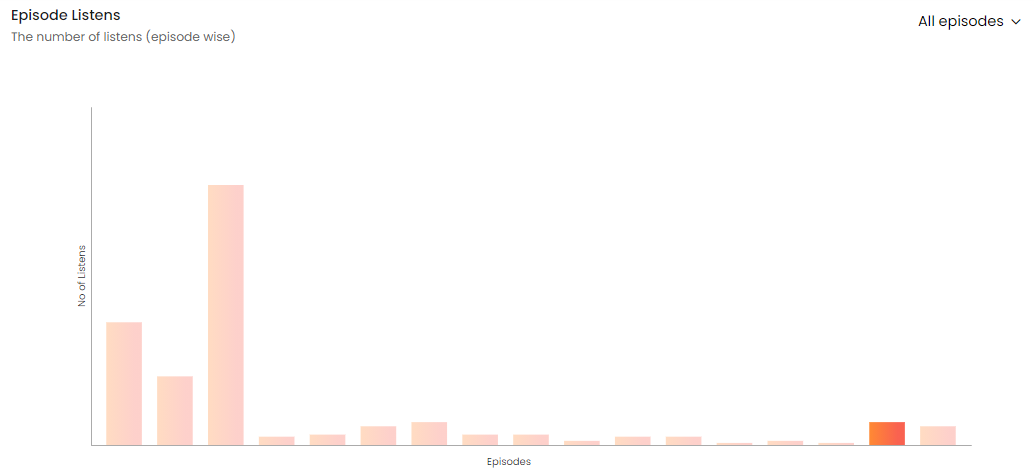
First, check out your least listened to episodes and figure out why they did poorly. Maybe the intro wasn’t engaging enough and listeners left before hearing out the whole episode. Was the sound quality low? Perhaps you didn’t prepare enough and didn’t take the time to frame the podcast for new listeners. Was the episode topic overrated?
Now check out your episodes that have high listenership and figure out why. Was it because of a guest appearance? Was it the fresh perspective that made it unique? Maybe you tried a different podcast format and it worked.
By spotting these patterns and anomalies in your episodes, you’d better understand your audience and plan the next course of your podcast.
My Top Episode
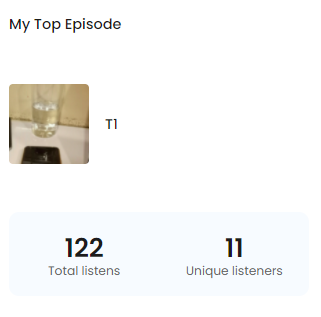
You can see your top podcast episode in your Hubhopper data analytics dashboard. You can see the total listens and unique listeners of your top episode. This data shows what type of content your audience likes the most.
Top Locations
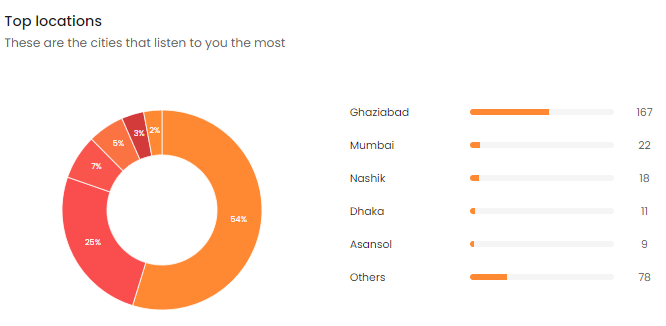
This demographic data shows you the top five cities that listen to your podcast the most. Through this analytics, you can see where your audience comes from.
You can get yourself acquainted with their cities to make special episodes for these listeners. This will make your content more relatable. You can also look at hosting events in these cities to grow your podcast community.
Spotify Analytics
Spotify is one of the most popular platforms that has been actively investing in the booming podcast industry. As the platform has been displaying more and more podcasts, the listenership has seen considerable growth.
Hubhopper analytics dashboard provides you the Spotify analytics data separately. You can choose the time range for analytics and it will give you the data analytics for that particular period.
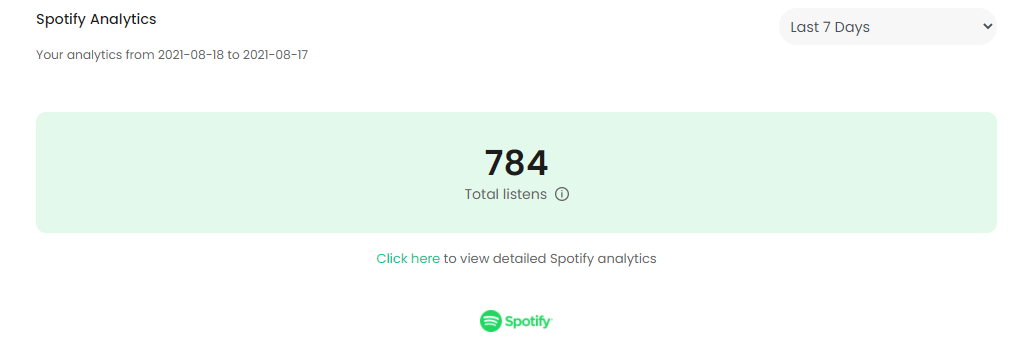
In Spotify Analytics, you can see the total listens. To get detailed analytics of the platform, click on the link below.
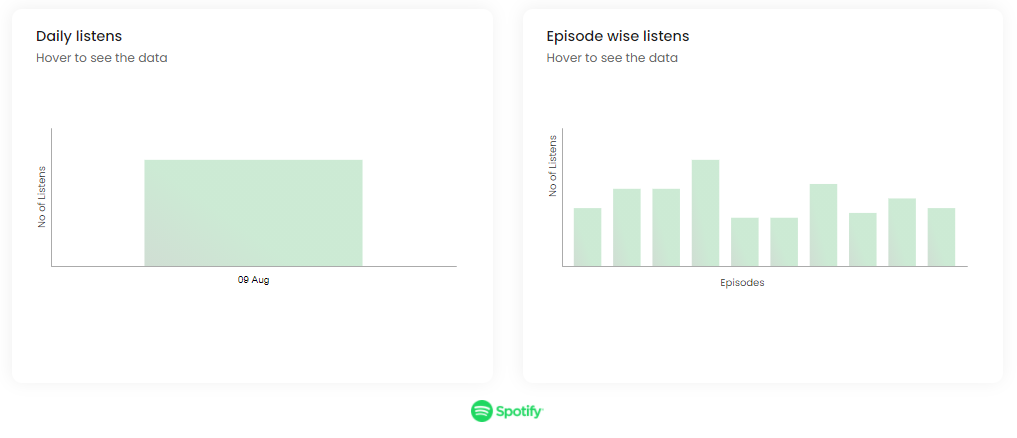
Here, you can view the daily listens as well as the episode wise listens. Again, this kind of data gives you an insight into your audience’s behavior pattern that you can use to hook new listeners.
We hope that the updated Hubhopper data analytics dashboard will help you track your podcast growth and understand your podcast and audience better. Head over to your Hubhopper dashboard to explore your updated podcast data analytics.